

A Creator’s Guide to Predict Customer Churn on Zanfia
Losing a customer feels bad. But to really build a sustainable business, you have to get past the feeling and into the data. Predicting who is going to leave requires looking at the breadcrumbs they leave behind—or the ones they stop leaving altogether.
We're talking about digging into engagement data. How often are they logging in? Are they finishing your courses? Spotting these patterns before a member cancels is the key. It’s the difference between reacting to lost revenue and proactively saving a relationship you’ve worked hard to build.
Why Churn Prediction Is a Creator's Superpower

For any creator running a business on Zanfia, member retention is your engine for growth. Churn—when a customer cancels—isn't just another metric on a dashboard. It's a quiet killer of your revenue, your momentum, and your morale.
Each person who leaves takes more than just their subscription fee with them. You also lose out on their potential for community contributions, valuable feedback, and word-of-mouth marketing.
The constant hustle to find new customers is exhausting and expensive. The real secret to a thriving digital business lies in keeping the members you already have. They provide a stable revenue floor, become your biggest advocates, and create the kind of vibrant community that naturally attracts new people. Zanfia is built around this idea: an AI team that runs the business day to day across courses, communities, and newsletters, dictated by chat or voice, all landing in a checkout built to sell.
The Real Cost of Losing a Customer
It’s tempting to shrug off a few cancellations here and there, but that’s a dangerous mindset. Even a small monthly churn rate snowballs over time, steadily draining your subscriber base.
Picture a leaky bucket. You can pour new water in (new customers) all day long, but if you don't plug the holes (churn), you'll never get it full. That's why retention is absolutely critical for your long-term stability.
Globally, businesses lose an unbelievable $1.6 trillion every year because of churn. But here’s the upside: cutting churn by just 5% can boost revenue by 25-95%. For a creator, that means identifying and re-engaging just a handful of at-risk members each month can make a massive difference to your bottom line.
Let’s make it real. A creator earning $2,500 a month with a 5% monthly churn rate will lose over $1,400 in annual revenue from that initial group of customers alone. If you can predict and prevent just half of those cancellations, you're putting thousands directly back into your business.
From Reactive to Proactive
This is where the magic happens. Predicting churn flips the script on retention. It stops being a reactive damage-control exercise and becomes a proactive, strategic part of how you run your business.
You'll stop asking, "Why did they leave?" and start asking, "Who might be thinking about leaving, and how can I step in and help?"
This proactive approach opens up a whole new playbook:
- Intervene Early: You can reach out to solve a member's problem before it becomes their reason to cancel.
- Personalize Engagement: Is someone drifting away? Now you can send them tailored content or a personal check-in to bring them back.
- Improve Your Offerings: Churn signals are often just brutally honest feedback. They shine a light on weaknesses in your courses or community, giving you a clear roadmap for what to improve.
Ultimately, mastering churn prediction is about getting to know your audience on a deeper level. It's about understanding their journey and making it better—a skill that’s at the heart of building an exceptional customer experience. If you want to dive deeper, our guide on what is customer experience management is a great place to start.
Finding Your Data Goldmine Within Zanfia

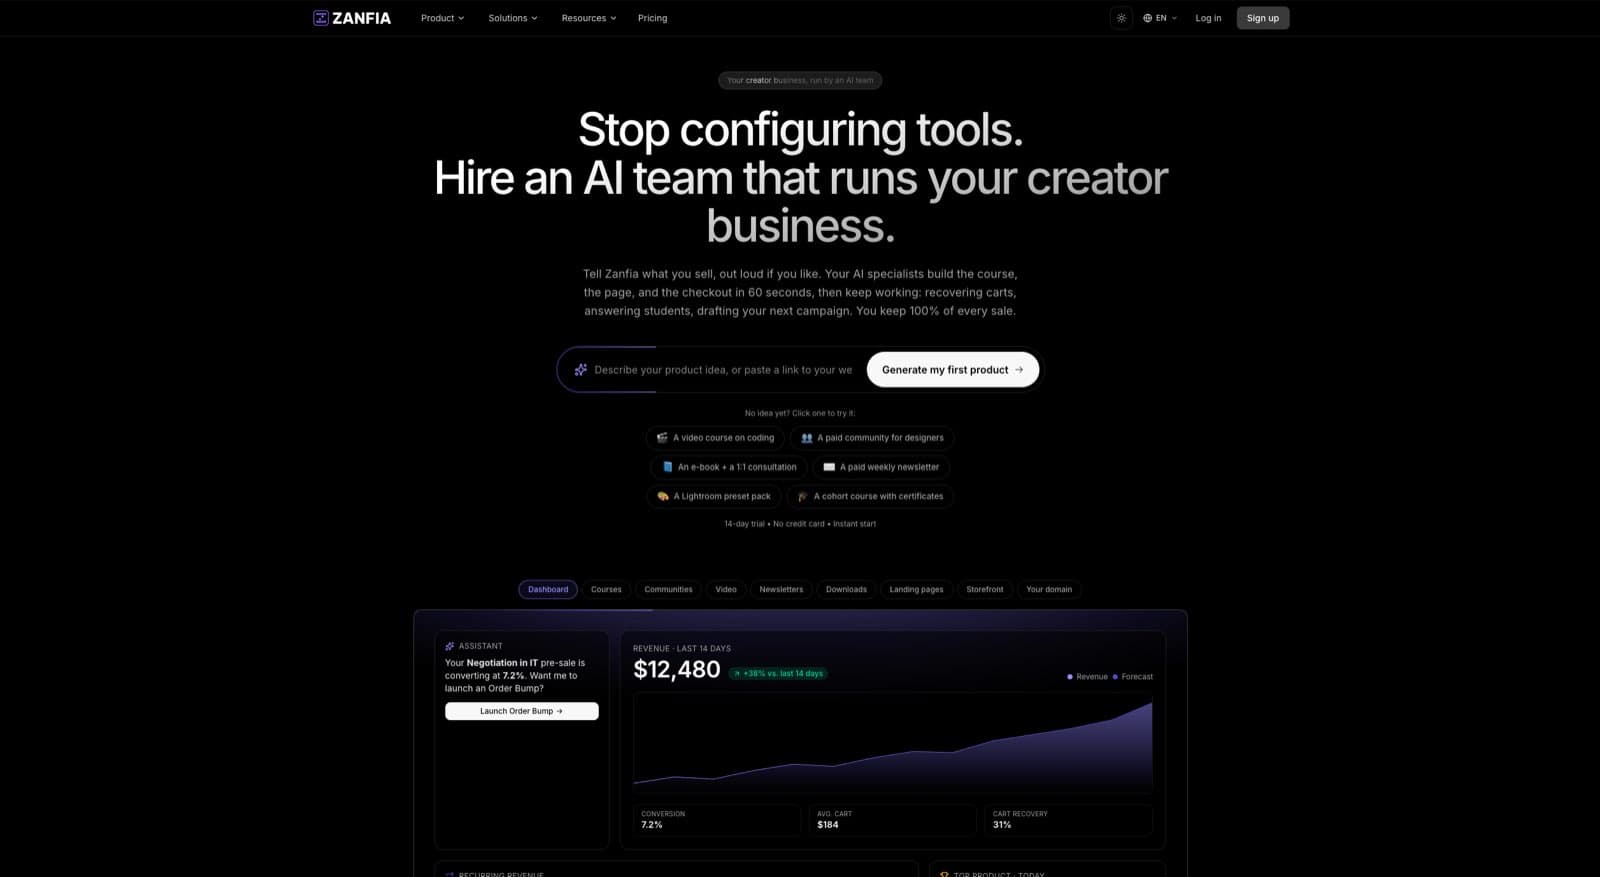
Before you can predict anything, you need the right raw materials. Your Zanfia workspace is a treasure trove of information, but the real magic for predicting churn isn't in your sales numbers. It’s in the behavioral metrics—the digital breadcrumbs your members leave behind every time they interact with your courses and community.
These signals tell a far richer story than a simple transaction history. Think about it: a customer who bought your flagship course six months ago might look great on paper. But if they haven't logged in for 90 days? That's a massive red flag.
It's this combination of purchase data and actual engagement that forms the bedrock of a reliable prediction model. And because Zanfia is AI-first, you don't have to hunt this down by hand: you can ask the assistant, by chat or voice, to pull the segment for you and hand it back ready to act on.
Gathering Your Core Data Points
First things first, let's pull the essential data you can get directly from Zanfia. The goal here is to build a simple spreadsheet—Google Sheets or Excel is perfect—where every row is a unique customer and every column is a specific data point about them.
I recommend thinking in terms of these key categories:
- Community Activity: How often are they posting? How many comments did they leave in the last 30 days ? Zanfia's integrated community tools let you track engagement across topic channels, roles, and gamification signals, so you keep a pulse on social investment.
- Course Progress: Which courses did they enroll in? What percentage of the lessons have they actually finished? With Zanfia's native video hosting, smart player, and course analytics, you can see exactly where students are and how they consume your content.
- Purchase History: When did they first buy from you? Are they a subscriber, a one-off buyer, or paying in installments (say, a $600 course split into four payments)? Knowing the products they own helps paint a picture of their initial goals and lifetime value.
- Login & Session Data: When was their last login? How many times did they log in this month versus last month? A sharp drop-off here is one of the classic leading indicators of churn.
A sudden shift in engagement is almost always the most powerful churn predictor you have. A once-active community member who goes radio silent or a student who stalls halfway through a course is waving a red flag. These are the people you need to spot first.
To get a better handle on where you are and where you want to go with your data, it's really helpful to frame your efforts using an analytics maturity model.
Organizing Your Dataset for Prediction
Once you know which metrics you need, start exporting the relevant reports from your Zanfia analytics dashboard. The platform's built-in tools give you deep visibility into the entire customer journey, which makes gathering this info much easier. Deeper analytics unlock on higher plans, so check the current Zanfia pricing to see what your workspace has today.
Your first spreadsheet might look something like this:
| Customer ID | Last Login | Courses Completed | Community Posts (Last 30 Days) | Subscription Start |
|---|---|---|---|---|
| CUST-001 | 2 days ago | 4 | 12 | Jan 5, 2023 |
| CUST-002 | 45 days ago | 1 | 0 | Feb 11, 2023 |
| CUST-003 | 1 day ago | 8 | 25 | Nov 20, 2022 |
This simple, organized table is the launchpad for your entire churn prediction project. It turns abstract user activity into a structured format that you can start analyzing for patterns.
You don't need fancy, expensive software to get started. This foundational dataset is all it takes to build your very first model. For more ideas on what to track, our guide on how to analyze website traffic covers some broader principles of engagement that apply here, too.
The Vital Churn Metrics Every Zanfia Creator Must Track
If you want to get ahead of customer churn, you need to look beyond that single, top-level number everyone obsesses over. Sure, your overall churn rate is a decent health check, but the real story—the actionable insight—is buried in the metrics that explain why and how your members are leaving.
The goal isn't just to measure churn; it's to understand it. That means shifting your focus from lagging indicators (people who already left) to leading indicators—the subtle signals that tell you who might be on their way out long before they ever click "cancel."
Moving Past the Basic Churn Rate
The standard Customer Churn Rate is where most people start and, unfortunately, where many stop. You calculate it by taking the number of customers who left in a period, dividing it by the total customers you had at the start, and multiplying by 100. It’s simple, but it can be misleading.
A much sharper metric is Revenue Churn. Instead of counting lost customers, this tracks the percentage of monthly recurring revenue (MRR) you've lost from your existing base. Why is this so much better? Because not all customers are created equal. Losing one high-ticket member on your premium plan can hurt your bottom line more than losing three people on your cheapest tier. Revenue Churn cuts through the noise and shows you the real financial damage.
For a Zanfia creator, this distinction is everything. Because Zanfia charges 0% platform commission on customer sales as of today, every dollar of revenue you keep is yours (only the payment processor takes its standard cut). A 3% Customer Churn might seem low, but if it translates to 10% Revenue Churn, it means your highest-value members are leaving—a critical problem that a basic churn rate would hide.
To give you a clearer picture, here’s a quick breakdown of the essential metrics you can start tracking on Zanfia.
Essential Churn Prediction Metrics on Zanfia
This table outlines the key metrics that give you a 360-degree view of member retention.
| Metric | How to Calculate | What It Tells You |
|---|---|---|
| Customer Churn Rate | (Lost Customers / Total Customers at Start) * 100 | The percentage of your total customer base that left over a period. A basic health check. |
| Revenue Churn Rate | (MRR Lost from Churn / Total MRR at Start) * 100 | The percentage of revenue lost from departing customers. Highlights the financial impact of churn. |
| Customer Lifetime Value (LTV) | (Average Revenue Per Customer) * (Average Customer Lifespan) | The total revenue you can expect from a single customer. A declining LTV signals customers are leaving sooner. |
| Customer Health Score | A custom, weighted score based on key engagement actions. | A proactive, predictive score that segments users into healthy, at-risk, and critical groups. |
Focusing on this mix of metrics gives you a far more nuanced understanding of your business's health.
Customer Lifetime Value and Engagement Scores
Speaking of proactive metrics, Customer Lifetime Value (LTV) is a powerhouse. It represents the total revenue you can expect from a single customer over their entire journey with you. When your average LTV starts to drop, it’s a clear sign that members are churning faster than they used to, cutting their value short. If you haven't dug into this yet, there are some great methods for calculating your customer lifetime value that can fit any business model.
But the real magic happens when you start tracking behavior. This is where a Customer Health Score comes in. Think of it as a custom credit score for member engagement. You decide what actions matter most, assign points to them, and create a simple score that gives you an at-a-glance view of who’s thriving and who’s fading away.
For a Zanfia creator, a simple health score could look something like this:
- Logged in this week: +10 points
- Completed a course module: +20 points
- Posted in the community: +15 points
- No activity for 30 days: -30 points
With this in place, you can instantly see who your champions are (those with high scores) and, more importantly, identify your "at-risk" segment (those whose scores are dropping). This isn't just data for a spreadsheet; it's a practical, day-to-day tool that tells you exactly who needs a nudge, a check-in, or a special offer before it's too late. It turns prediction into action.
Building Your First Churn Prediction Model
Now that your data is clean and organized, it's time to put it to work. The idea isn't to become a data scientist overnight. It’s about building a practical model that gives you a real edge in keeping your customers around. You can get started today with tools you probably already have open.
The simplest place to start is with a rule-based model. This is a totally no-code approach where you just set a few logical tripwires to flag at-risk members based on their behavior (or lack thereof).
For a creator on Zanfia, this might look like:
- The Inactivity Rule: Any subscriber who hasn't logged in for 30 consecutive days gets a red flag.
- The Stagnation Rule: Any student who hasn't touched a new course module in 45 days is drifting.
- The Silence Rule: Any community member who hasn't posted or commented in 60 days is likely disengaged.
These rules are surprisingly powerful because they're immediate. You don't need fancy software—just sort a spreadsheet and see who meets the criteria. On Zanfia you can shortcut this even further: tell the assistant, out loud if you like, "show me every subscriber who hasn't logged in for 30 days" and the segment comes back for you to act on.
Leveling Up with Spreadsheets
For a slightly more nuanced view, you can use basic functions in Google Sheets or Excel. Here, we move from simple tripwires to a weighted scoring system, a bit like the customer health score we talked about earlier.
It's pretty straightforward. You assign negative points for inactivity and positive points for engagement.
- First, make a new column called something like "Churn Risk Score."
- Use a simple
IFformula. For instance, if a user'slast_loginwas more than 30 days ago, subtract 20 points . - Add another condition. If their
community_postsin the last month is over 5 , add 10 points . - Keep doing this for your most important metrics, summing them all up for a final risk score.
Anyone with a big negative number is a high churn risk. This approach lets you blend multiple signals into one score, giving you a much clearer picture of who needs attention. By creating segments based on these scores, you can target your re-engagement campaigns with way more precision. For more on this, check out our guide to audience segmentation strategies.
The Power of More Advanced Tools
As you grow, you'll probably want more predictive muscle without getting bogged down in code. This is where modern no-code or low-code analytics tools come in. These platforms plug right into your data sources and use machine learning to find subtle patterns you'd never spot on your own. Zanfia also exposes an MCP endpoint on higher plans, so you can let an outside AI assistant work directly with your workspace data (availability depends on the plan—see the current Zanfia pricing).
In the subscription world that platforms like Zanfia operate in, a small 5% monthly churn rate doesn't sound like much, but it snowballs fast. Over a year, it means losing nearly 46% of your customers. On the flip side, companies that use health scores to trigger interventions have been shown to cut churn by 16-28%, which can boost net retention by 5-12%. You can discover more insights on the state of retention in 2025.
These tools automate the heavy lifting of building more sophisticated models, like logistic regression or decision trees. They can analyze dozens of variables at once to calculate a precise churn probability for every single customer. And while that sounds complex, they're built for founders and creators, not just data scientists.
In the end, the best model is the one you actually use. Start with simple rules. Graduate to a spreadsheet score. Then, when you're ready, explore more powerful tools. The most important thing is to start predicting now with what you have.
Turning Churn Predictions into Retention Wins
A prediction model is a powerful tool, but let's be honest: its real value isn't in the data it spits out. It’s in the action it inspires.
Once your model flags a customer as being at-risk, the clock starts ticking. This is your chance to intervene, re-engage, and turn a potential cancellation into a story of renewed loyalty. The key is to act fast and with relevance, hitting on the likely reasons they’re drifting away.
This is where Zanfia's automation engine becomes your secret weapon. Instead of manually tracking at-risk members and firing off one-off emails, you can build workflows that trigger personalized interventions the moment a customer’s health score drops. Because Zanfia is AI-first, you can spin these workflows up by describing them to the assistant in plain language, by chat or by voice, instead of clicking through a builder. This flips your churn prediction from a periodic report into a real-time, always-on retention engine.
Building Your Automated Retention Playbook
The most effective retention strategies are tailored to the specific signals a customer is sending. A member who has gone silent in the community has a different problem than one who is stuck halfway through a course. Your response should reflect that.
Here are a few practical playbooks you can set up directly within Zanfia:
- For the Silent Community Member: If a member's community posts drop to zero for 30 days , trigger an automated email. Don't just say, "We miss you." Invite them to a low-commitment event like an "Ask Me Anything" session or share a link to a recent hot topic to reignite their interest.
- For the Stalled Student: When a user's course progress stalls for several weeks, automatically send them an encouraging note. You could offer a quick tip related to the last module they completed or a link to a community channel where they can ask questions about that specific topic.
- For the High-Value Drifter: If a long-term member with a high lifetime value shows a sudden drop in login frequency, they might be reconsidering their investment. This is the perfect time for a high-touch intervention. Automate a task for yourself to send a personal video message, or drop them into a checkout with an order bump or a discounted add-on to bring them back into the product.
The decision tree below can help you figure out which type of prediction model is the right starting point to power these actions, based on your current resources and skills.
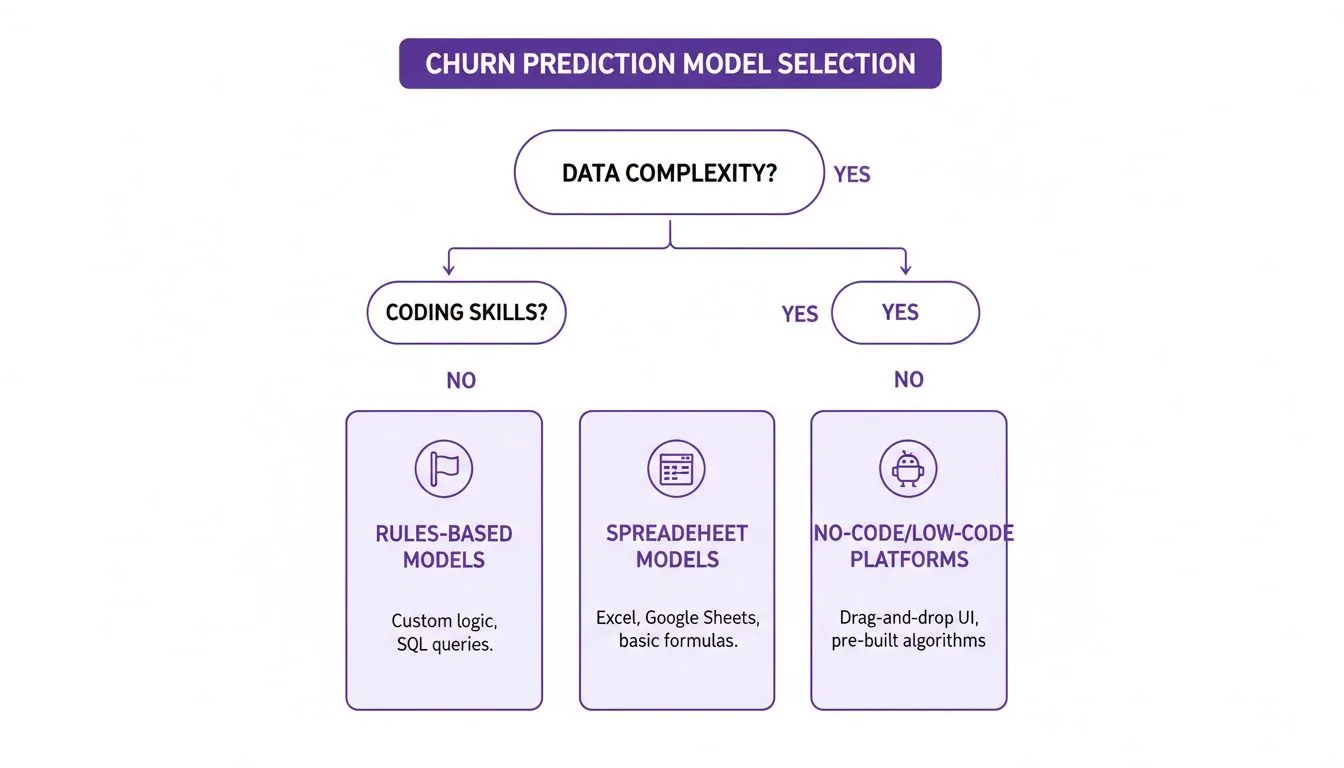
This framework ensures you can start implementing these retention strategies right away, no matter where you're starting from.
The Financial Impact of Proactive Retention
Putting these strategies into motion is about more than just keeping customers happy—it’s about protecting your revenue.
The media and professional services sectors, which align closely with Zanfia's creator base, boast industry-leading retention rates of 84%. The financial logic is undeniable: existing customers spend 67% more than new ones, and a huge driver of churn is simply feeling unappreciated.
By turning predictions into timely, personalized actions, you’re not just reducing churn; you're actively reinforcing the value of your offerings. You're showing your members that you're paying attention and are invested in their success, which is the foundation of long-term loyalty. You might also be interested in our dedicated guide on how to reduce customer churn.
Ultimately, the goal here is to significantly improve marketing ROI with AI strategies by maximizing the lifetime value of every single customer you worked so hard to acquire in the first place.
A Few Common Questions About Churn Prediction
Even with a solid plan, a few questions always pop up when creators first dive into churn prediction. Let's tackle the most common ones I hear, so you can move forward with confidence on Zanfia.
The goal here isn't to turn you into a data scientist overnight. It's to demystify the process and show you that with the right focus, you can make a real dent in your churn rate, starting today.
How Much Data Do I Really Need to Start?
You probably need less than you think. You don’t need a massive, perfectly clean dataset to get going. Honestly, with just a few months of data from 50-100 customers, you can start spotting basic patterns.
The trick is to start simple. Forget complex models for now. Begin with rule-based heuristics, like flagging a user who hasn't logged in for 30 days. As your community on Zanfia grows, your data gets richer, and that’s when you can graduate to more sophisticated methods. The biggest mistake is waiting for "perfect" data—just start with what you have.
If I Could Only Track One Thing, What's the Best Metric for Churn?
For most creators using a platform like Zanfia, the single most powerful predictor is a change in engagement frequency. This isn't about financials; it's about behavior.
Think about login frequency, how active someone is in the community, or how much progress they're making in a course. A sudden nosedive in activity from a member who used to be a regular is your canary in the coal mine. It's often the very first sign they're losing interest or not getting the value they hoped for. Tracking this "engagement velocity" is your best bet for catching churn risk early, long before a credit card fails.
Can I Actually Automate This Stuff in Zanfia?
Absolutely. This is where the magic happens. Once your model flags an at-risk segment—even a simple one—you can use Zanfia’s automation engine to spring into action without lifting a finger. You can even set it up by dictating what you want to the assistant, rather than clicking through a builder.
For instance, you could build a workflow that automatically:
- Sends a personalized 'Hey, we miss you!' email to anyone who hasn't logged in for 21 days.
- Tags disengaged members and drops them into a re-engagement sequence that highlights a new piece of content or offers a small bonus at a checkout built with order bumps and upsells.
- Creates a task for you to personally check in on high-value clients who show signs of drifting away.
The real win here is turning your predictions into an automated, hands-off retention machine. A well-designed automation can easily save you 5–10+ hours a month, freeing you up to focus on creating great content instead of chasing down lapsed customers. It works for you 24/7.
This is what makes your churn model more than just a fancy report. It connects insight directly to action, ensuring no one slips through the cracks and protecting the revenue you've worked so hard to build.
Stop losing revenue to preventable churn and start building a more resilient online business. With Zanfia, an AI team runs the day-to-day work across courses, communities, and newsletters—dictated by chat or voice—and lands it in a checkout built to sell, with order bumps, installments, and test mode before you launch. Plans start at $39/month, or $31/month billed annually, with a 14-day free trial and no credit card required, and Zanfia charges 0% platform commission on customer sales as of today. Discover how Zanfia can help you grow.